- We can exploit the relationship between
and
to measure
and
for a reaction.
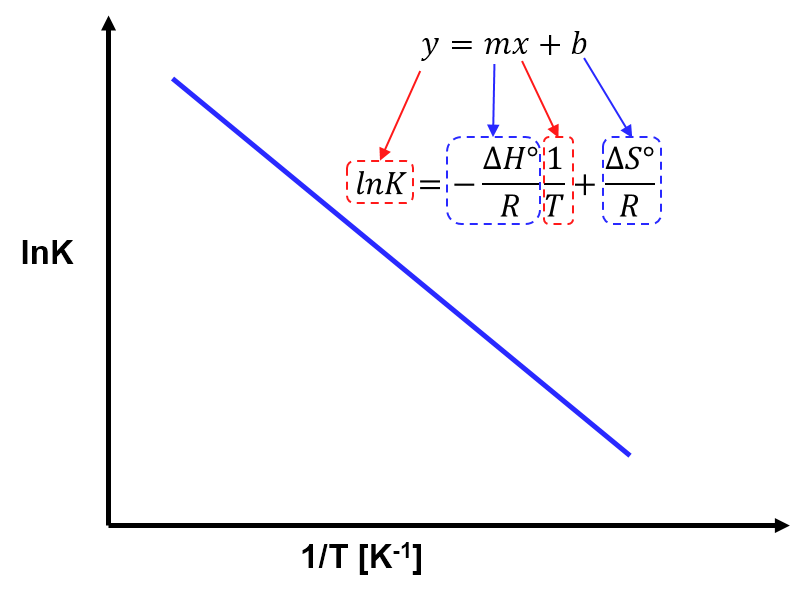
- The van't Hoff equation,
, describes the linear relationship for a plot of lnK vs (1/T).
Experimentally, we can exploit the relationship between and
to measure
and
for a reaction. Recall from Section 4.2 that, at constant temperature,
and
.
Equating these two formulae gives
.
Dividing both sides by -RT and rearranging gives
(Equation 1).
Thus, if we measure the equilibrium constant, , for a reaction at different temperatures,
, and plot
as the y values and
as the x values, the result should be a straight line. Such a plot is called a van't Hoff plot. The generic equation for a straight line is
, where
is the slope and
is the y intercept. Comparing this generic equation with Equation 1, above, shows that when
and
, the slope of the line is
and the y-intercept is
.
Van't Hoff plots are useful ways to experimentally measure and
using the slope and intercept of the line.
Note that both and
vary with temperature and yet van't Hoff plots are constructed using a range of temperatures. The values of
and
are much less sensitive to temperature than
, so it is reasonable to assume that
and
are approximately constant over reasonable temperature ranges. We will know if the temperature range of a van't Hoff plot is not 'reasonable' enough to make this assumption if the experimental data points connect to form a curve rather than a straight line. In CHEM 123, the temperature ranges given with van't Hoff plots will always be 'reasonable'.
View solution: