- The Arrhenius equation is
- The linear form of the Arrhenius equation is
.
- A plot of
versus
gives a straight line with slope
and y-intercept
, where A is the pre-exponential factor.
Consider the reaction coordinate diagram below:
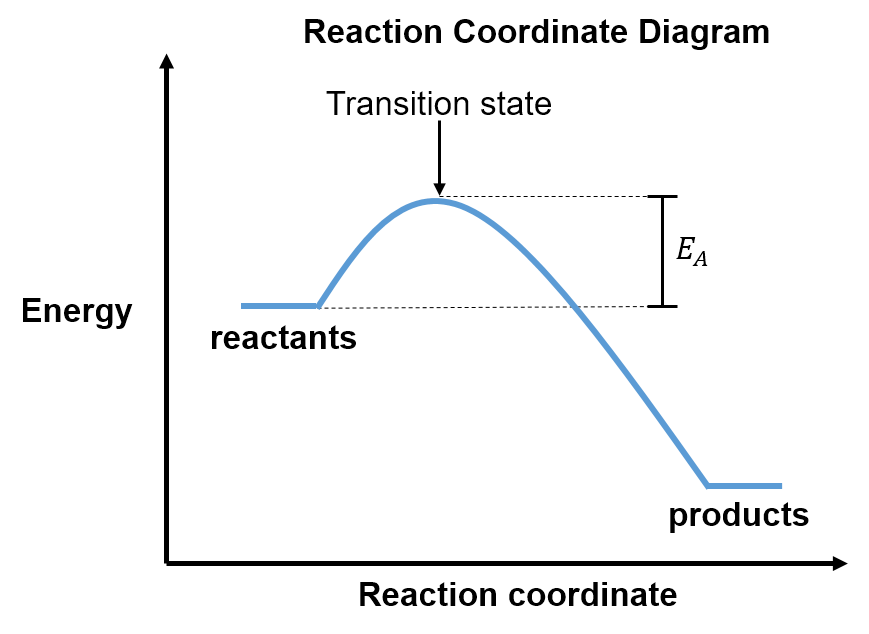
Notice that this diagram is slightly different from the reaction coordinate diagrams used in Section 1 since the y-axis here is energy (E) instead of free energy (G). On this diagram, the difference in energy between the reactants and transition state is called the activation energy, . Activation energy is an empirically derived term (i.e. measured using experiments). While the activation energy is not as rigorous as the free energy of activation used in Section 1 since it ignores entropy, it is historically important and accurate enough that it is still widely used. We will build on our work here to come back to the free energy of activation in the next section.
As introduced in Section 1, the reactants must collide with enough kinetic energy to overcome the potential energy barrier (activation energy) in order to become products. Complete the activity below to review how the activation energy and temperature of a reaction affect the reaction rate.
While temperature () and activation energy (
) clearly affect reaction rates, neither
nor
appeared in any of the rate laws presented in Section 1. This is because the rate constant,
, incorporates both of these terms. The relationship between
,
, and
is presented in the Arrhenius equation (Equation 1),
(Equation 1),
where R is the universal gas constant and A is the pre-exponential factor (an experimentally determined proportionality constant that differs for each reaction). The Arrhenius equation is an emperical formula, which means that it is based on experimental evidence rather than derived from fundamental theories.
We have already studied how to measure the rate constant, , through experimentally determined rate laws (Section 1.2) or integrated rate laws (Sections 1.4 and 1.5). We do not yet, though, have a way to measure
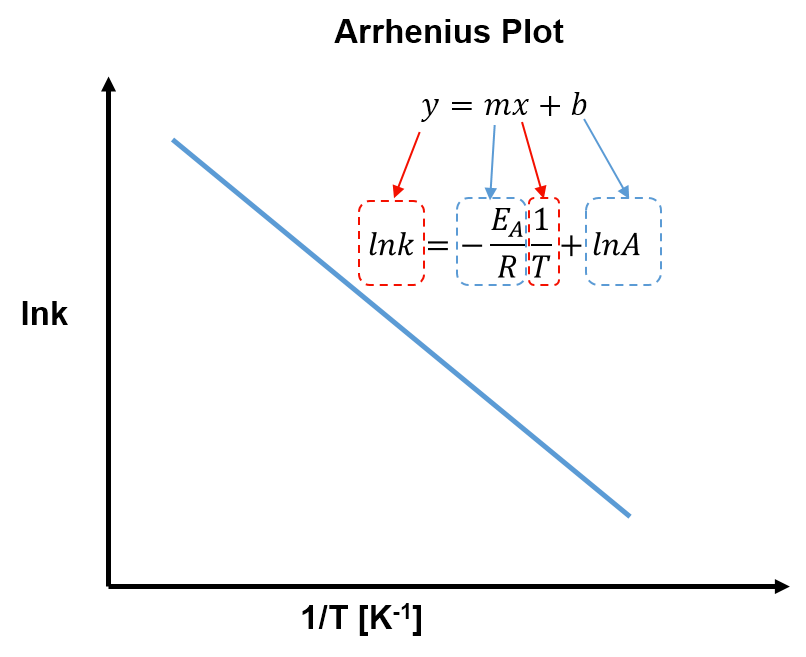
. Taking the natural logarithm of both sides of Equation 1 gives
(Equation 2).
Comparing Equation 2 with the generic equation of a straight line, , we can see that a plot of
versus
gives a linear plot with slope
and y-intercept
. This is called an Arrhenius plot, as shown below.
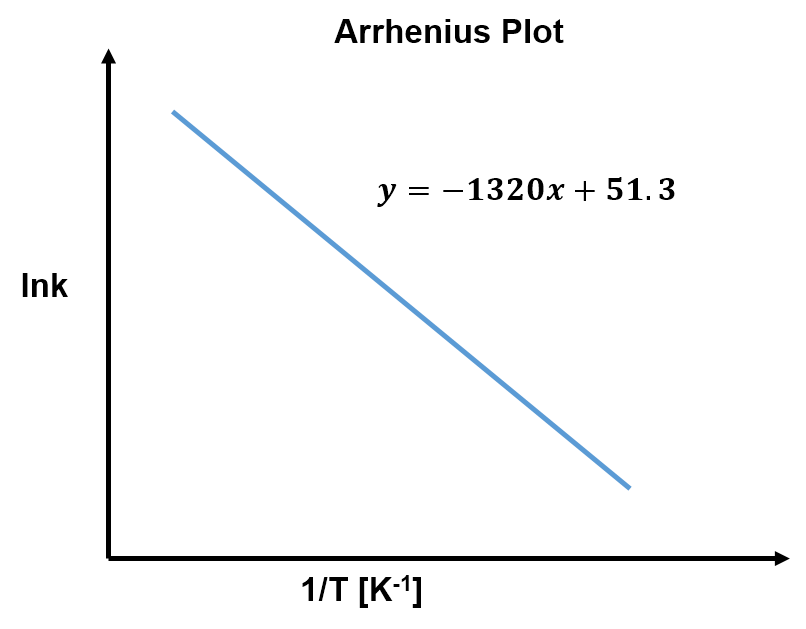
View solution:
The slope of an Arrhenius plot is
,
so the activation energy is
Interactive: