- The change in standard Gibbs free energy, ΔGo, for a reaction is the difference in free energy between the pure products at standard state and the pure reactants at standard state.
for pure elements in their standard states.
- The sign of
indicates whether a reaction is spontaneous (
) or non-spontaneous (
) when given a specified proportion of reactants and/or products.
- At equilibrium, the relationship between
is given by
The change in standard Gibbs free energy, ΔGo, for a reaction is the difference in free energy between the pure products at standard state and the pure reactants at standard state.
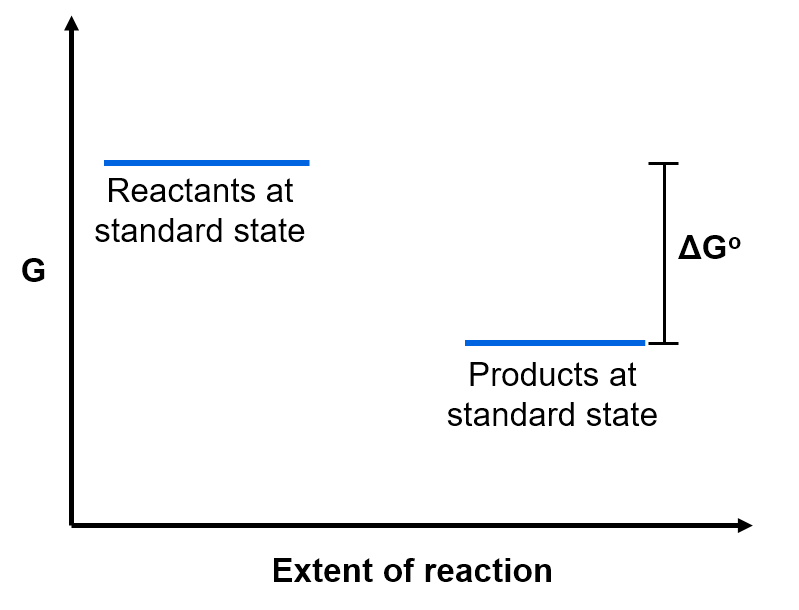
In the example above, because the Gibbs free energy of the products at standard state is lower than the Gibbs free energy of the reactants at standard state.
As with any state variable, we can use a variation of Hess' Law to calculate the change in standard Gibbs free energy using tabulated free energy of formation data. The free energy of formation is the free energy change associated with the formation of a molecule from its pure elements at standard state (see formation reactions). The standard Gibbs free energy change of the reaction is given by the difference between the free energy of formation for the products and reactants.
depends on
via
.
Just as we set for pure elements in their standard states as a reference value,
is also set to 0 kJ/mol for pure elements in their standard state as a reference point.
View solution:
Note that each value is multiplied by the coefficient in the balanced reaction, and that
is 0 kJ/mol for O2.
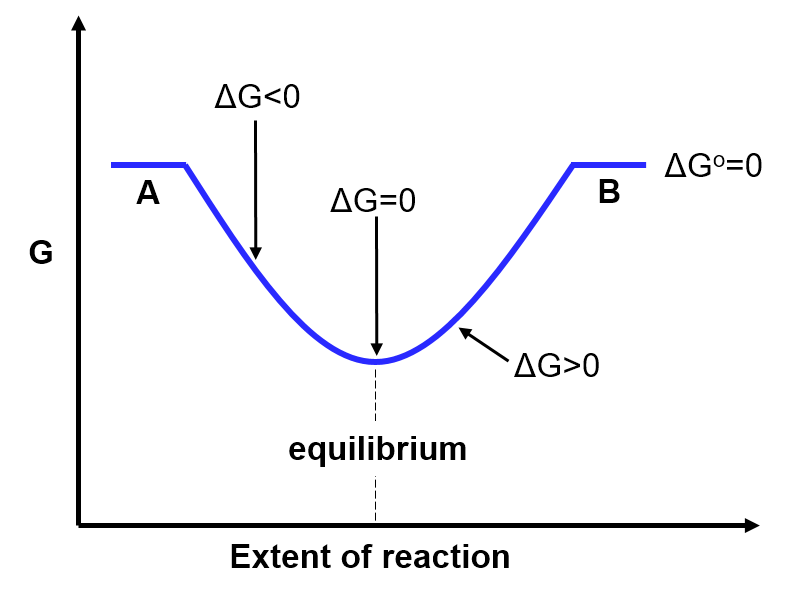
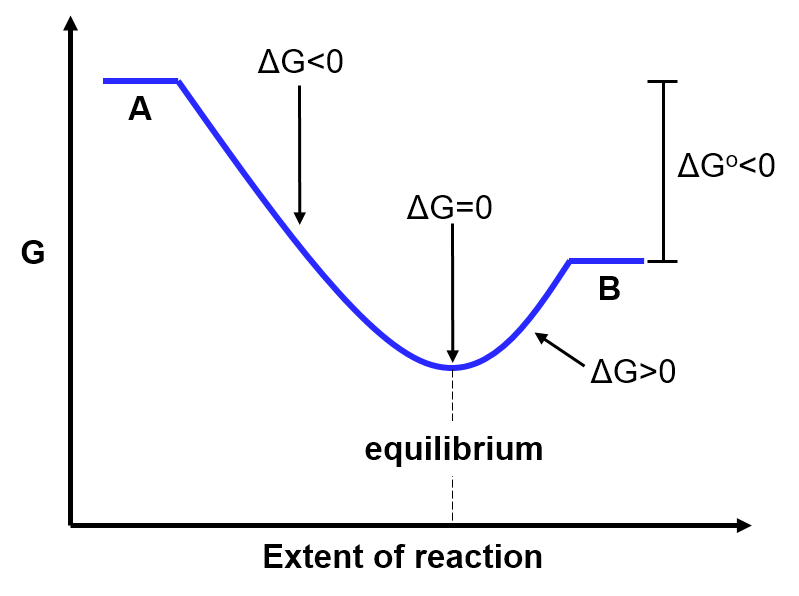
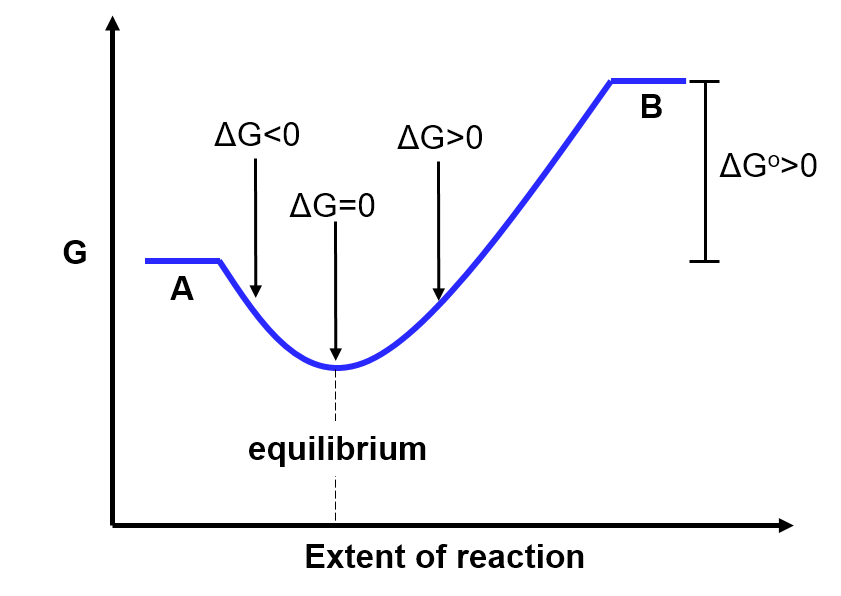
tells us about the difference in free energy between reactants and products at standard state, but cannot predict the spontaneity of a reaction, since reactions don't occur under conditions of standard state. Instead, we rely on
values to predict the spontaneity of a reaction. The value of
reflects how far away any specified proportion of reactants and/or products is from the equilibrium position. The sign of
reflects whether the reaction would have to proceed forward towards products (
) or backwards towards reactants (
) to reach equilibrium. The magnitude of
reflects how far away the specified reaction position is from the equilibrium position. Reaction positions associated with smaller
magnitudes are closer to equilibrium. Since a reaction gets closer and closer to equilibrium as it progresses, the magnitude of
decreases as the reaction progresses. Once the reaction reaches equilibrium,
. Note that
does not change as the reaction progresses because the free energy difference between pure reactants and pure products at standard state does not change with reaction progress.
You can explore the relationships between the reaction extent (current position), equilibrium position, , and
by dragging the slider below:
What is true of the current position (compared to equilibrium) when ΔG<0?
When ΔG<0, the ratio of reactants to products in the current position is higher than at equilibrium. That is, there are are more reactants (red dots) and fewer products (blue dots) than at equilibrium. This reaction will proceed spontaneously in the forward direction.
What is true of the current position (compared to equilibrium) when ΔG=0?
When ΔG=0, the ratio of reactants to products is the same in the current and equilibrium positions. That is, the reaction is at equilibrium.
What is true of the current position (compared to equilibrium) when ΔG>0?
When ΔG>0, the ratio of reactants to products in the current position is lower than at equilibrium. That is, there are are fewer reactants (red dots) and more products (blue dots) than at equilibrium. This reaction will proceed spontaneously in the reverse direction.
As illustrated in the above slider, the value of ΔG relates to the current position of the reaction (i.e. the relative number of reactants vs products). We can quantify the current position using the reaction quotient, Q. The reaction quotient, , is defined similarly to the equilibrium constant,
, in that it relates to the ratio of products over reactants. For example,
for the reaction
is given by
.
In the equation above, each concentration term reflects the current state of the system. Note that this is different than K, where the concentration terms must be equilibrium concentrations. K is the special name given to Q when a system is at equilibrium.
Review: Equilibrium
Chemical equilibrium is the state where reactants and products are both present and their concentrations do not change. Consider the reaction
.
At equilibrium, the forward reaction () proceeds at the same rate as the reverse reaction (
), such that there is no net change in the amount of A, B, C, or D.
The rates of the forward and reverse reactions are only equal when the relative proportions of the reactants and products satisfy the equilibrium constant, K, where K is defined as
(Equation 2)
and [A], [B], [C], and [D] are the concentrations of the reactants and products at equilibrium.
Removing reactants (A or B) from the reaction would immediately decrease the rate of the forward reaction while the rate of the reverse reaction remains unchanged. The relatively higher rate of the reverse reaction would result in a net increase of reactants (A and B) and a net decrease in products (C and D) until equation 2 is satisfied again. That is, the reaction would 'shift' towards the reactant side to counteract the removal of reactants. This tendency of an equilibrium reaction to counteract any change is referred to as le Chatelier's Principle. Similarly, removing products (C or D) would cause the reaction to 'shift' towards the product side to re-establish equilibrium.
The value of ΔG relates to the current position of the system, Q, by
(Equation 1)
The derivation of Equation 1 is beyond the scope of this course. At equilibrium, ΔG=0 and Q=K, so we can rewrite this equation as
(Equation 2)
Rearranging Equation 2 above shows the relationship between and
.
(Equation 3).
That is, defines the position of the equilibrium. Note that while we used the condition of equilibrium to help us arrive at Equation 3, this equality is true even when the reaction is not at equilibrium, since
has the same value no matter what position the reaction is in.
View solution:
Note that was converted to
to cancel with the units of R.
We can understand the relationship between ΔGo and K conceptually by recalling that Go relates to (
at constant temperature and pressure) and thus to the probability associated with a state. States with lower Go (higher
) are associated with more probable states and states with higher Go (lower
) are associated with less probable states. At equilibrium we'd expect the relative amount of each chemical species to correspond to its Gibbs free energy: chemical species with lower Go (higher
/ probability) are present in greater amounts than chemical species with higher Go (lower
/ probability).
To visualize this relationship between and
, consider the simple reaction
with three different values of .
- A and B have equal Gibbs free energy (
)
In the situation where A and B have the same Gibbs free energy (), we'd expect them to be present in equal amounts at equilibrium. Mathematically, if
and thus. Since
, this value of K means that there are an equal number of products and reactants at equilibrium (
), as predicted.
This is illustrated in the graph below: The y-axis is the Gibbs free energy. The x-axis is the extent of the reaction (from 100% reactants / 0% products (left side) → 75% reactants / 25% products → 50% reactants / 50% products → 25% reactants / 75% products → 0% reactants / 100% products (right side)). The fact that. Notice that in this case where
- A has higher Gibbs free energy than B (
)
If the Gibbs free energy of A is higher than that of B (), then we'd expect there to be relatively more B than A at equilibrium. Mathematically, if
is larger than
, then
Based on Equation 3 this means that
and thus K must be larger than 1 (
). When
, the products are favoured at equilibrium, as predicted.
This is illustrated in the diagram below: notice that equilibrium (the lowest point on the graph when
- A has lower Gibbs free energy than B (
)
In the situation where the Gibbs free energy of A is lower than that of B (), we would predict that the equilibrium position would thus lie closer to the reactants (A). Mathematically, if
then
. Since
, this means that there are more reactants than products at equilibrium (
) which matches our prediction.
This is also illustrated in the diagram below. The equilibrium position occurs at a point along the x-axis that is closer to the reactants (A) than the products (B). This indicates that there are more reactants than products at equilibrium.
Interactive: