- The spontaneity of a reaction does not indicate how quickly it occurs.
- Chemical kinetics describes the rates of chemical reactions.
- Reaction coordinate diagrams visualize how G changes as reactants transform into products.
- A transition state is the highest free energy point on a reaction coordinate diagram.
- The free energy difference between the reactants and transition state is called the free energy of activation.
- The free energy of activation dictates the rate of a chemical reaction.
- An intermediate is a chemical species that is produced then subsequently consumed in a reaction, such that it does not appear in the overall reaction as a reactant nor product.
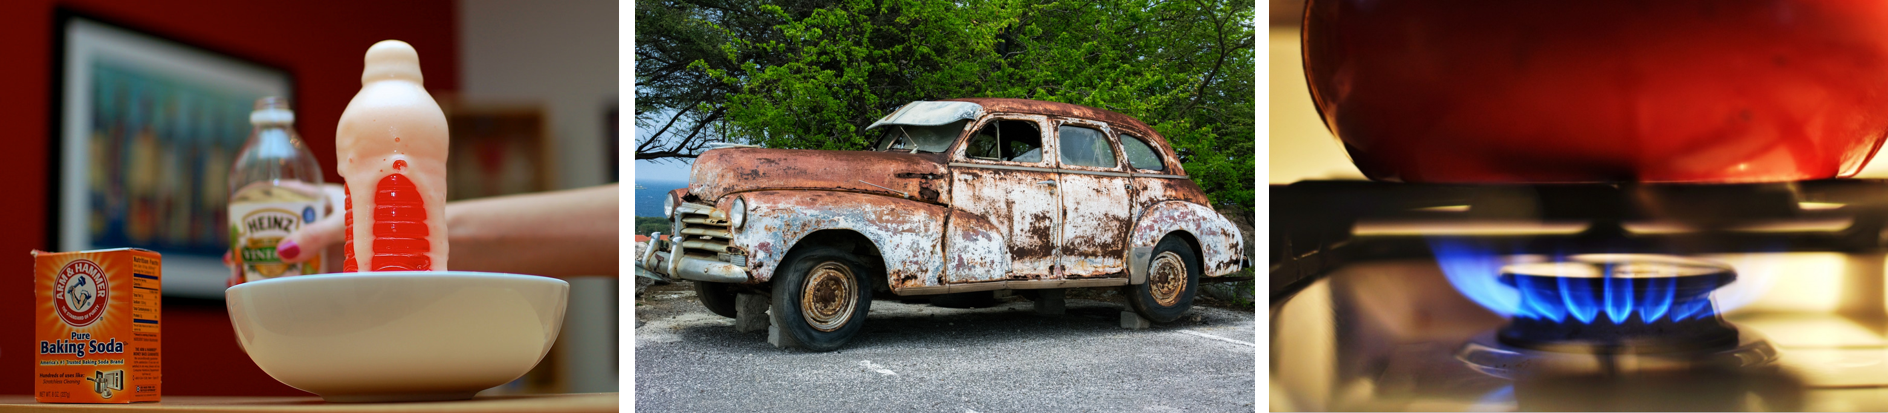
Thermodynamics (Part 1) predicts whether any given reaction is spontaneous. Knowing that a reaction is spontaneous, though, is not enough to conclude that it actually occurs on a reasonable timescale because thermodynamics has no relation to time. For instance, (1) the reaction between baking soda (NaHCO3) and vinegar (CH3COOH), (2) the rusting of a car, and (3) the combustion of propane are all spontaneous processes, and yet (1) occurs rapidly, (2) occurs slowly, and, (3) requires an initial spark.
Given that all three of these processes result in a product with lower Gibbs free energy than the reactants, why do they not all occur rapidly at room temperature? To understand the reason, consider how the reactants become products. As reactants transform into products, bonds break and/or form. During this process, the bond angles often distort and more electrons may be concentrated around an atom (as bonds are both partially formed and partially broken) leading to increased electron-electron repulsion. That is, even though the products have a lower Gibbs free energy than the reactants, the reactants must pass through a state with higher Gibbs free energy as they transform into products.
We can visualize this explanation using a reaction coordinate diagram, shown below.
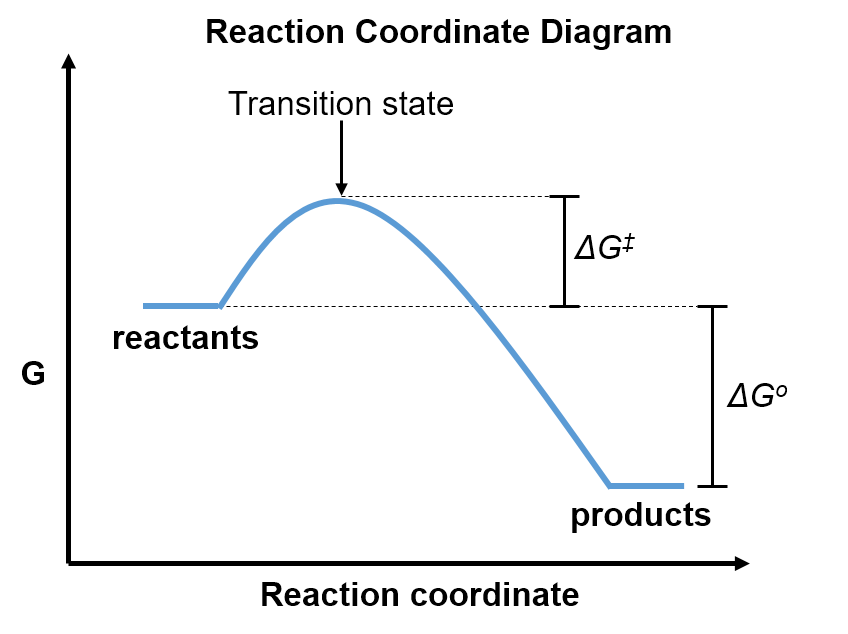
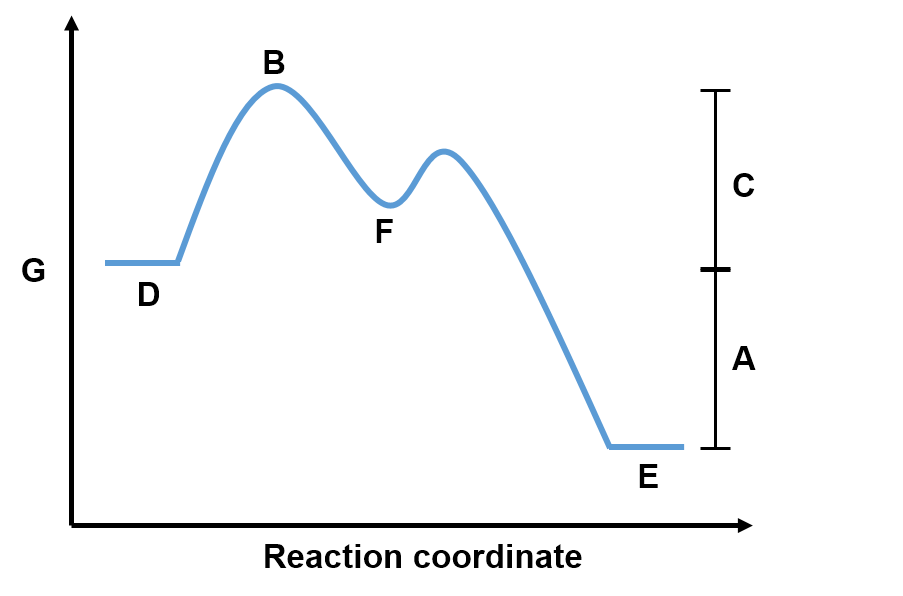
A reaction coordinate diagram shows how the Gibbs free energy (y-axis) changes as the reactants transform into products along the reaction coordinate (x-axis). The transient structure along this pathway that has the highest free energy is called the transition state. In the transition state, bonds are partially formed and/or broken. The reactants must pass through this transition state in order to transform into products, so must have enough energy to overcome this free energy barrier. The free energy difference between the reactants and transition state is called the free energy of activation, ‡. This is the minimum free energy required for reactants to transform into products, even when
.
You can visualize an example of how reactants transform into products along the reaction coordinate by moving the slider below:
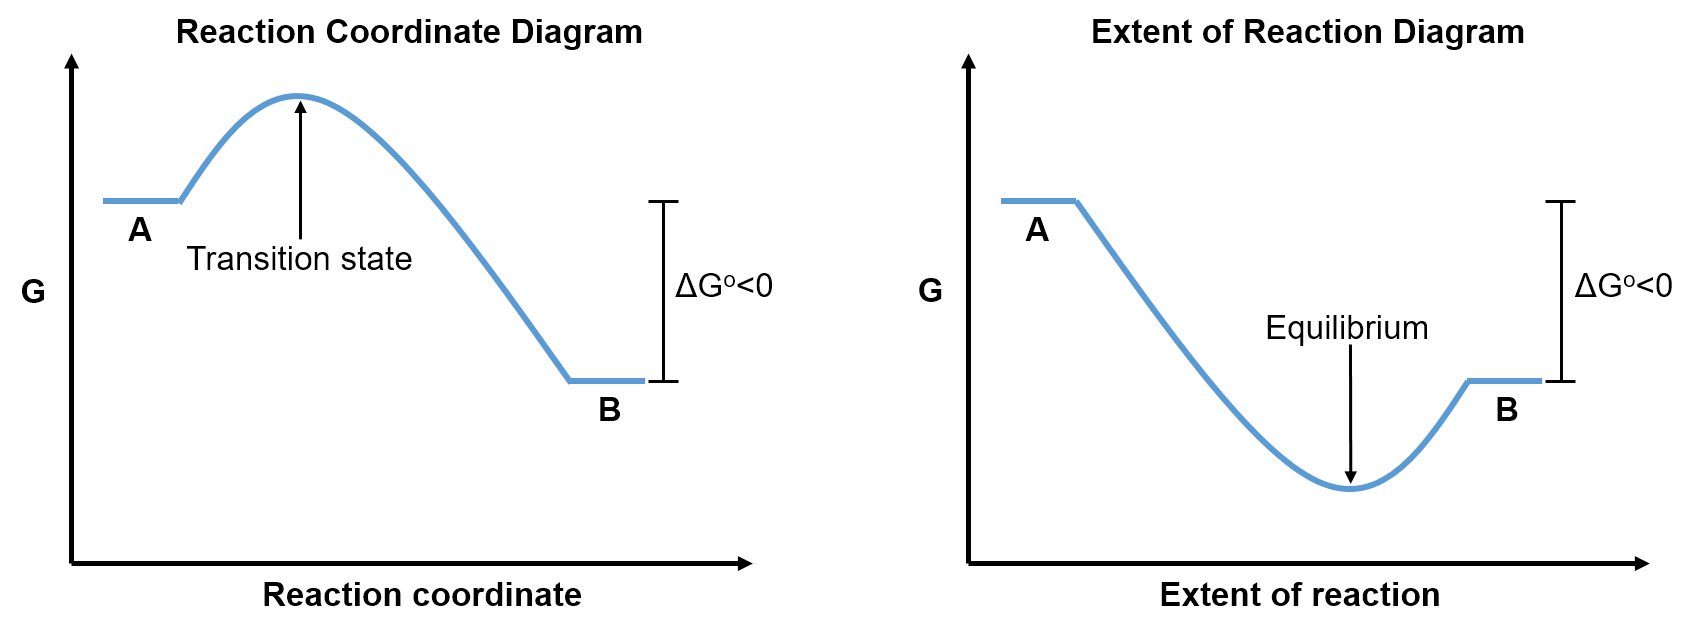
Reaction Coordinate versus Extent of Reaction
Reaction coordinate diagrams are different than the extent of reaction diagrams introduced in Part 1, Section 4. While the y-axis is Gibbs free energy for both diagrams, a reaction coordinate diagram has the reaction coordinate as the x-axis whereas the extent of reaction diagram has the extent of reaction as the x-axis. The reaction coordinate describes the progress of a single (set of) reactant(s) transforming into a single (set of) product(s). This transformation requires passing through a high energy transition state, so reaction coordinate diagrams have a peak between the reactants and products. The extent of reaction refers to the proportion of reactants versus products in the bulk solution. Such diagrams pass through a trough between the reactants and products, since the most stable (lowest G) solution has both reactants and products present at their equilibrium proportions.
Different reactions have different free energies of activation. A reactions with a smaller ‡ occurs more rapidly because (at a given temperature) more reactants have enough free energy to overcome this barrier to become products.
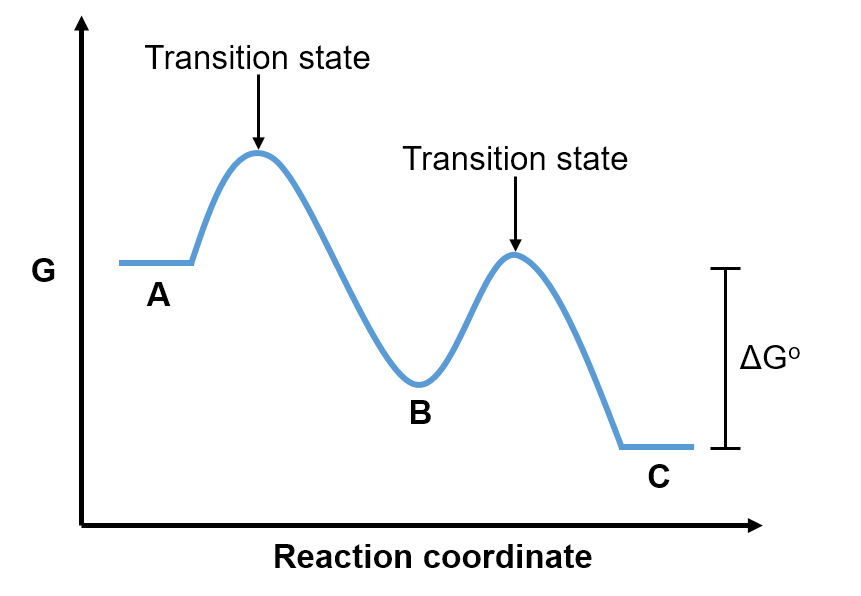
Some reactions occur via multiple steps. For example, even though an overall reaction may be , it's possible that first A reacts to form B (
) and then B subsequently reacts to form C (
). In such a case, B is called an intermediate since it is first produced and then consumed, such that it does not appear in the overall reaction. For reactions that occur over multiple steps, each step has a transition state and the intermediate is visualized as a local minimum on the reaction coordinate diagram.
Interactive: